Data analytics, reporting and real-time monitoring
Your numbers in one place. Current, not last week's.
Your data sits in the ERP, the warehouse system, Excel and a handful of other tools. Someone glues a report together from four exports on Friday and by Monday it is out of date. I design a data structure that brings the sources into one model, and on top of it reports and dashboards that fill themselves, including real-time monitoring.
01Why choose me?
What you get out of working together, beyond a working solution
One model instead of ten exports
Data from the ERP, accounting, warehouse, CRM and spreadsheets goes into one structure with the same code lists and definitions. Revenue, margin or stock then mean the same thing in every report, not whatever the person who built it decided.
A structure designed for analytics
A data warehouse or analytical database with a model that is easy to query: facts, dimensions and change history. The design decides whether a report runs in a second or in ten minutes.
Large volumes without breaking a sweat
Millions of rows of transactions, logs or readings, processed so that queries and reports stay fast. Aggregation, partitioning and indexes are settled at design time, not once the system starts choking.
Real-time monitoring
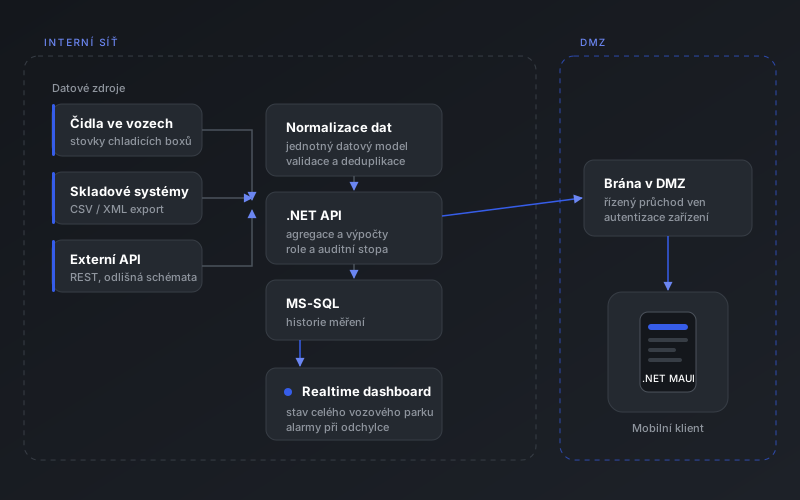
A dashboard that updates continuously, not once a night. That is how the temperature monitoring system I built for hundreds of refrigerated vehicles works: data flows in non-stop and the screen shows the current state.
Alerts where someone will see them
When a value crosses a limit or a source stops sending data, a message goes to Teams, email or the mobile app. An alert that ends up in a log helps nobody.
Your data stays with you
The solution runs in your own cloud tenant or on-premise. Role-based access, so a salesperson sees their numbers and management sees the whole picture.
02Types of solutions
Choose the solution that best fits your needs
Reporting and management overviews
Regular reports nobody has to assemble by hand.
- Revenue, margin, stock and plan fulfilment in one place
- Reports in Power BI or in a custom web app
- Automatic distribution at an agreed interval
- Drill-down from the summary to a single document
Real-time monitoring
The current state of operations, not yesterday's export.
- A live dashboard that updates without reloading
- Limits and alerts on deviation
- Checks that each data source reports at its expected interval
- Verifiable value history for inspections and audits
Data warehouse and structure design
The foundation reporting and analysis stand on.
- Data model design for analytics and reporting
- Connecting and cleaning data from ERP, databases and files
- Processing large data volumes and their history
- A base for AI data evaluation over the same model
03Proof from real projects
Real projects where I solved exactly this
04Where to find me and where I work from
I am based in Prague and in Tálín near Písek. Consultations run online or in person. I work with clients across the Czech Republic and abroad.
Prague
Letňany and surroundings
Tálín near Písek
South Bohemia
Online
Czech Republic and worldwide
05Frequently asked questions
Answers to the questions clients ask most often
01How is this different from the Power BI we already have?
Power BI is a display tool. Most of the work and most of the problems sit underneath it: where the data comes from, how it is cleaned and how the structure is designed. If Power BI suits you, I build the model and reports in it. If you need something it cannot do, such as live monitoring or an app for operations, I build that to measure.
02Our data is scattered across Excel and several systems. Is that workable?
Yes, it is the most common starting point. First we map where each piece of data is created and who maintains it, then I propose how to bring it into one model. Excel can still be loaded, it just stops being copied by hand.
03How much data can you handle?
Millions to hundreds of millions of rows are routine work if the structure is designed with care. I choose the architecture by volume and by how fast reports need to answer. I will not build a big data platform where a well-designed SQL database will do.
04What exactly does real-time monitoring mean?
That the values on screen reflect the state a few seconds ago, not last night's batch. Data is processed continuously as it arrives from systems or apps, and the dashboard updates itself. An alert comes while the deviation can still be dealt with.
Want your numbers in one place and up to date?
Tell me which report you currently assemble by hand, or what you find out too late. On a free intro call we will go through where the data can come from and what a first overview would involve. Online or in person in Prague and South Bohemia.
Or go back to the contact form →